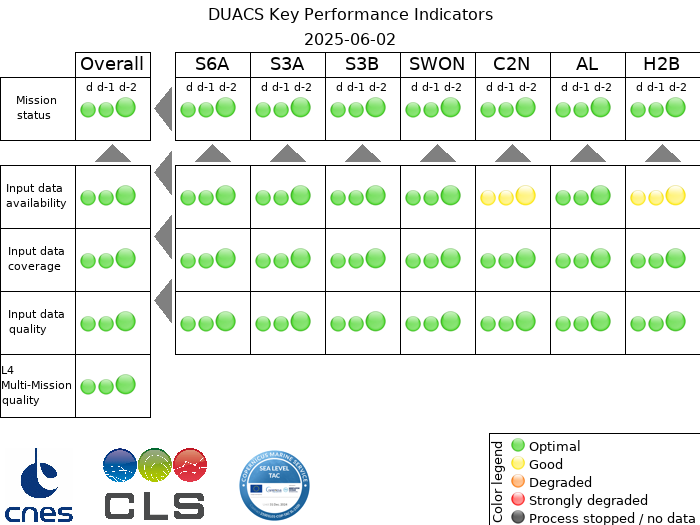
Duacs performance indicators are computed daily using the status of several components of the system :
- Input data availability
- Input data coverage
- Input data quality
- L4 Mutil-Mission quality
This is done for each and every currently working satellite, and combined to obtain the overall status.
These quality indicators are available either mission per mission or as a combination of those (Overall column). The main indicator (Column Overall, line Mission status) sums up the quality situation of the Duacs system. It is the synthesis of intermediate indicators, defined for each mission, considering each mission’s specificities. Five color levels have been defined: green, yellow, orange, red and black. Good system performances correspond to green and yellow indicators. A three-day history is provided along with the ‘Today’ indicator, so as to follow anomaly evolution.
Key Perfomance Indicators description
Mission per mission indicators
Four key indicators have been defined, corresponding to the main processing levels of the Duacs system (see DUACS processing overview):
- Input data availability: assesses the ancillary and raw data delivery delay with regard to the nominal delay.
- Input data coverage: gives an indication of missing data,
- Input data quality: this indicator synthesizes three different pieces of information,
- Performances at crossovers: thresholds on the standard deviation of sea surface height differences at crossovers.
- L4 Mutil-Mission quality: Thresholds on the Mean of the formal mapping error of the gridded map (err_sla in l4 product)
These indicators are computed for each mission. The global mission status indicator is an average of indicators 1 to 4.
Indicators combining the mission per mission indicators
For indicators 1, 2 and 3, the combined indicator is induced from the corresponding mission per mission ones thanks to a mean.
Combined indicator 4 is computed thanks to the merged gridded map.