SLA monitoring
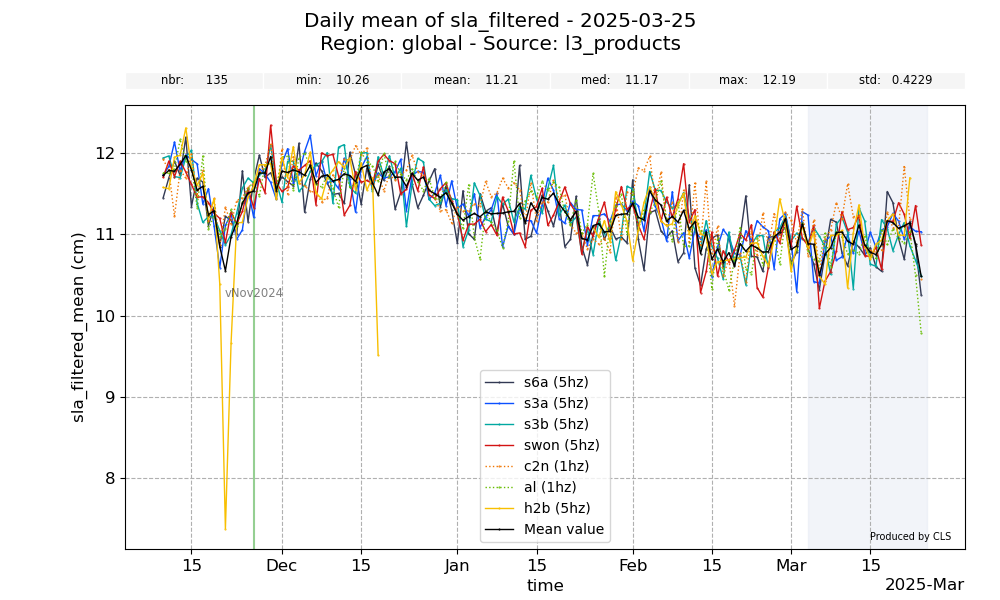
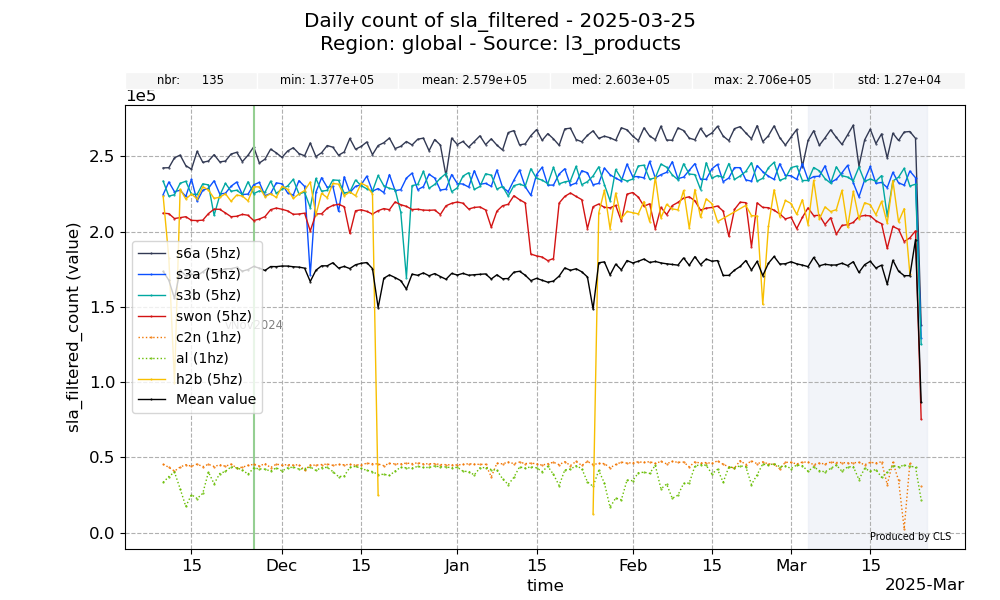
The following figures present the monitoring of the mean, variance and number of measurements of the SLA field available on the L3 product for the different altimeters over the past 3 months. Low-pass filtered SLA is considered (see DUACS processing).
High Frequency signal monitoring
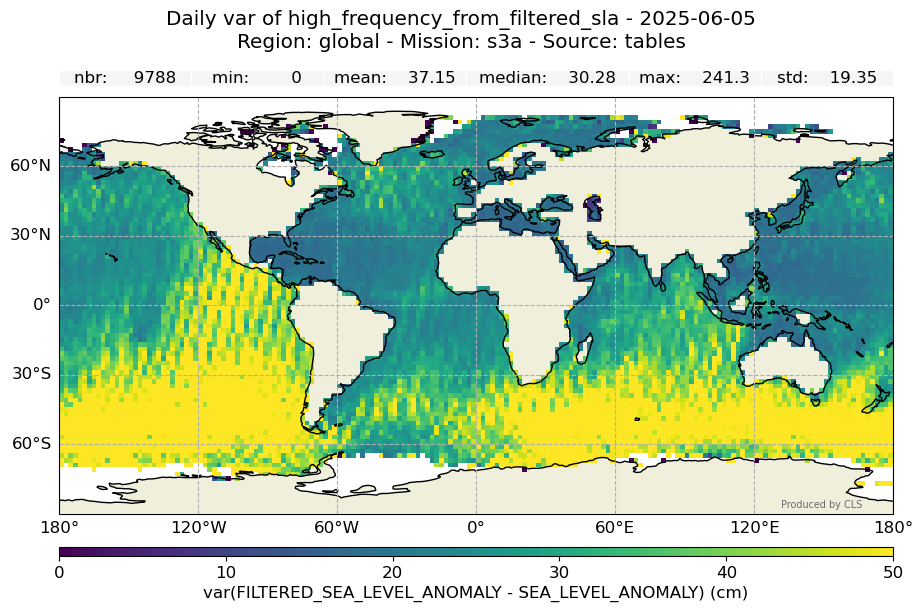
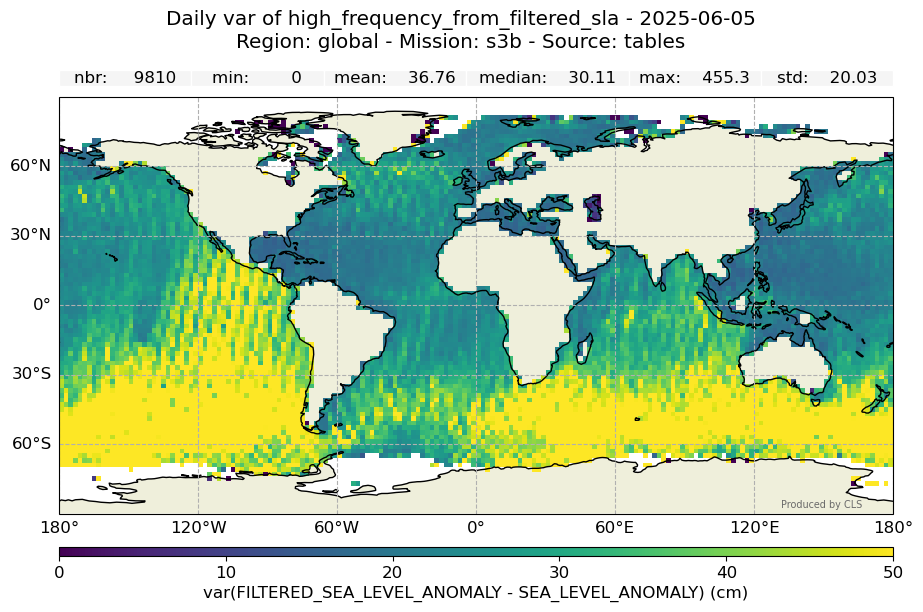
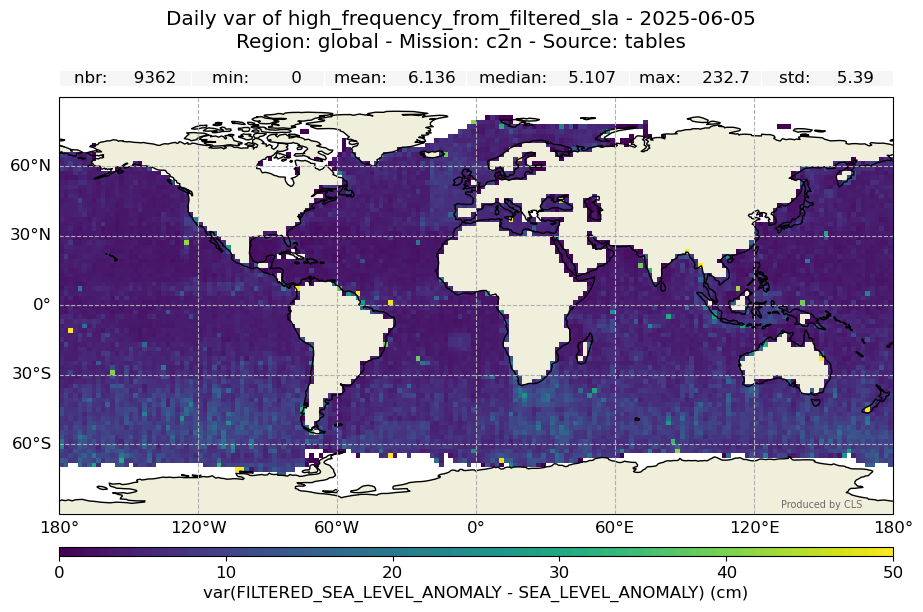
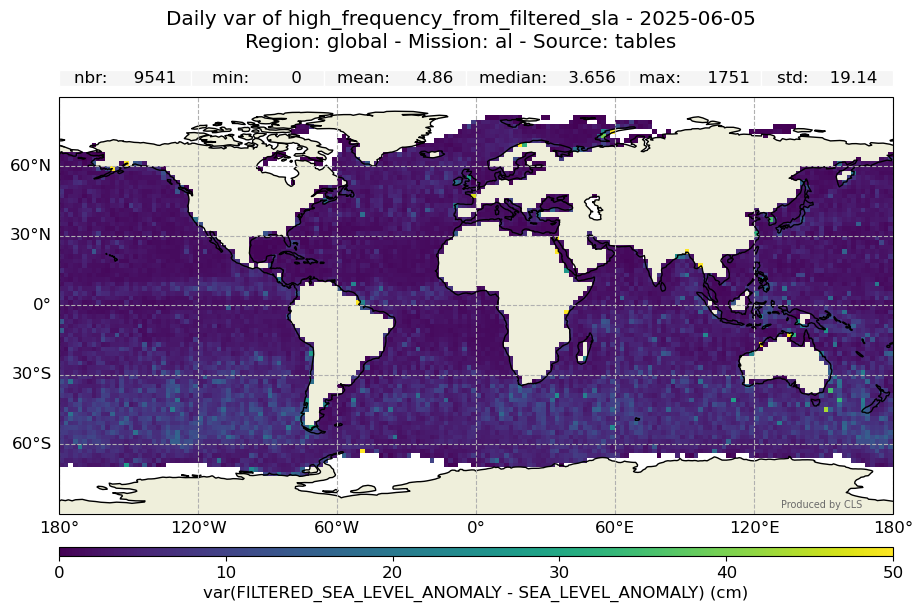
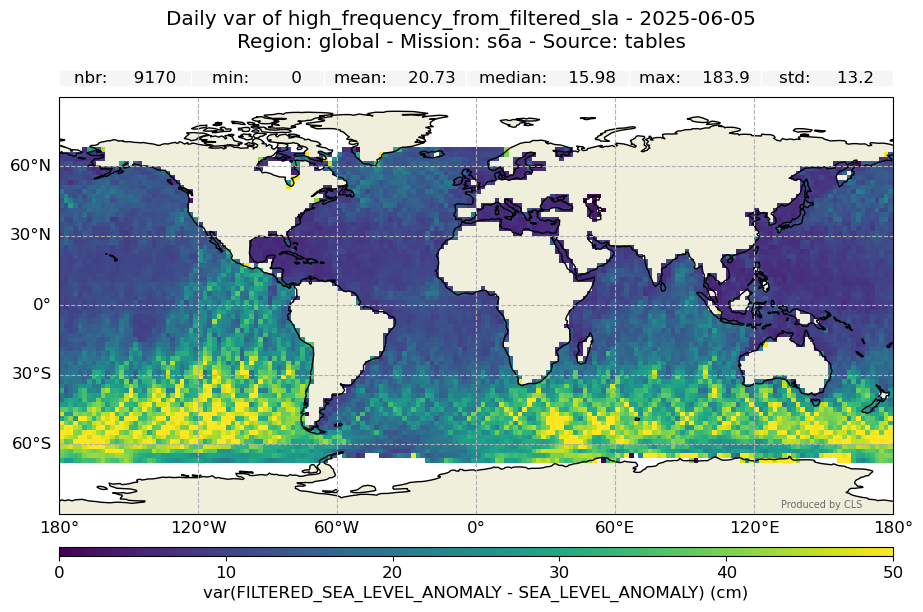
The following figure presents the monitoring of the variance of the high frequency signal that is considered as measurement noise errors. This high frequency signal can be reduced by low-pass filtering (see DUACS processing)

The variance of the high frequency signal is also estimated on 1°x1° boxes in order to highlight the geographical distribution of this signal. (Statistics computed over the past 50 days of IGDR/STC measurements)
#Change of orbit of J3N – During the tendem phase no available data

