New experimental Delayed-Time (DT/MY) L4 datasets has been added to the catalogue. This new L4 series enhances the content of the gridded sea-level variability in considering barotropic and equatorial wave variability. As described in (Ballarotta et al., 2023), this product is based on a multiscale and multivariate mapping approach that offers the possibility to improve the physical content of gridded products by resolving a broader spectrum of ocean surface dynamic than in the current operational mapping system. The new system simultaneously estimates the mesoscale ocean circulations as well as part of the equatorial wave dynamics (e.g. tropical instability and Poincaré waves) and barotropic dynamics.
The pronounced SSH variability observed in the equatorial band of the new MIOST maps is primarily linked to equatorial wave components. Previous studies (e.g. Farrar, 2008, 2011; Shinoda et al., 2009) have analyzed the zonal wavenumber–frequency spectrum of SSH in the Pacific to explore variability associated with tropical and equatorial waves. Figure 1 presents the base-10 logarithm of power in wavenumber–frequency space, computed from SSH in the equatorial Pacific ([10° S–10° N], [180–280° E]) over the period 2008–2018, for (a) the current MIOST DT product (b) the new experimental MIOST incorporating equatorial wave modes, and (c) the GLORYS12V1 reanalysis (Lellouche et al., 2018). The GLORYS12V1 ocean numerical simulation (Figure 1c) successfully captures rapid equatorial wave dynamics, revealing distinct spectral peaks at periods of approximately 4, 5, and 7 days for wavelengths exceeding 20° in longitude—features characteristic of inertia-gravity (Poincaré) waves. In contrast, the current MIOST DT product filters out SSH variability at timescales shorter than 10 days (Figure 1a). However, the new experimental MIOST incorporating equatorial wave modes resolves these spectral peaks near 4, 5, and 7 days for wavelengths >20° in longitude (Figure 1b). For timescales longer than 10 days, all datasets exhibit comparable spectral content, notably capturing the energetic westward propagation of equatorial Rossby waves for negative wavenumbers.
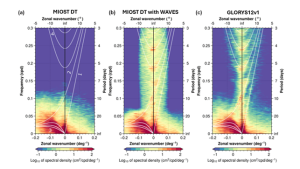
Figure 1: Zonal wavenumber–frequency spectrum of SLA in the equatorial Pacific computed for (a) MIOST DT, (b) MIOST DT with equatorial wave modes, and (c) the GLORYS12V1 reanalysis. White lines represent the theoretical dispersion relation curves for equatorial waves corresponding to the Kelvin [1], Yanai [2], Rossby [3], and Poincaré [4] waves.
Figure 2 illustrates that incorporating equatorial wave modes in MIOST significantly reduces mapping errors in this region. The largest SSH mapping error in MIOST DT (geostrophic mode only) reaches 50–100 cm2 in the western boundary surface current and over the continental plateaus (Figure 2a and b). In the offshore low-variability region, the error variance is <10 cm2. The differences in mapping error between MIOST with barotropic and equatorial wave modes and MIOST without these modes (geostrophy only) are presented in Figure 2c and d, respectively, for all spatial scales and for scales between 65 and 500 km. Across all spatial scales, the inclusion of equatorial wave modes reduces mapping errors in the equatorial band by more than 10%. However, in coastal equatorial regions—such as the Indonesian Archipelago and the western and eastern coasts of Africa and South America—errors tend to increase, suggesting that equatorial wave mapping is less suitable in these areas where different ocean processes are at play. In extra-equatorial regions, the impact of the barotropic mode in MIOST is assessed, showing a notable error reduction primarily at scales larger than 500 km, with reductions of up to 10% in mid-latitude regions characterized by strong barotropic signals.
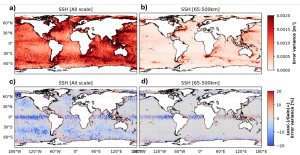
Figure 2: Reduction of the variance of the differences between SSHA L4and independent along-track measurements (here AltiKa), , when using the MIOST with mesoscale+equatorial waves + barotropic modes rather than only mesoscale modes. Resultats obtained when considering all the spatial scales (a & c) and only mesoscale signal (wavelengths ranging [65, 500km], b & d). Differences with the results obtained expressed in m² (a & b) and % of the SSHA variance (c & d).